Report
2010 Soybean Insect Losses for Mississippi, Tennessee, and Arkansas [pdf]
Musser, F. R.,*1 G. M. Lorenz,2 S. D. Stewart,3 and A. L. Catchot, Jr.1
1Department of Biochem., Mol. Biol., Entomol. and Plant Pathol., Mississippi State University, Box 9775, Mississippi State, MS 39762
2University of Arkansas CES, Lonoke Extension Center, 2001 Highway 70 East, Lonoke, AR 72086
3WTREC, The University of Tennessee, 605 Airways Blvd., Jackson TN 38301
*corresponding author email: fm61@msstate.edu
Accepted: 6-I-2011
Abstract Survey-based soybean insect losses provide a glimpse of current soybean management practices and allow the detection of evolving trends. This survey was initiated in Mississippi in 2004, Tennessee in 2008, and Arkansas in 2009. The 2010 survey shows stink bugs and corn earworm caused similar amounts of damage in the region. Combined, these two insects caused more than half of all insect losses in 2010. Insect scouting and the adoption of seed treatments were at similar levels compared to 2009.
Key Words: soybean, yield loss, pest management
Introduction
Soybean losses have been compiled annually since 2004 in Mississippi (Musser and Catchot 2008), since 2008 in Tennessee (Musser et al. 2009), and since 2009 in Arkansas (Musser et al. 2010), providing an annual record of insect pressure and management decisions. These estimates are based on surveys of consultants and extension personnel, similar to those used to estimate insect losses in cotton (Williams 2006). While the costs and losses estimated for a pest in any given year are somewhat subjective, these losses provide an historical record of pest pressure and management practices, and also provide an estimate of the economic impact of the various soybean pests.
Materials and Methods
A telephone or written survey was conducted with numerous crop consultants and extension personnel in the fall of the year. The survey was limited to people who actively scouted soybean fields and those who assisted growers in making soybean pest management decisions. These surveys were compiled and then combined with our own experience to estimate the various fields in the table. Acreage, yield, and price data were drawn from Agricultural Statistics Service publications (USDA NASS). The estimates were placed in an Excel spreadsheet (Microsoft Office 2003, Microsoft Corp.) to make the various calculations. The actual formulas used in the spreadsheet were published by Musser and Catchot (2008).
Results and Discussion
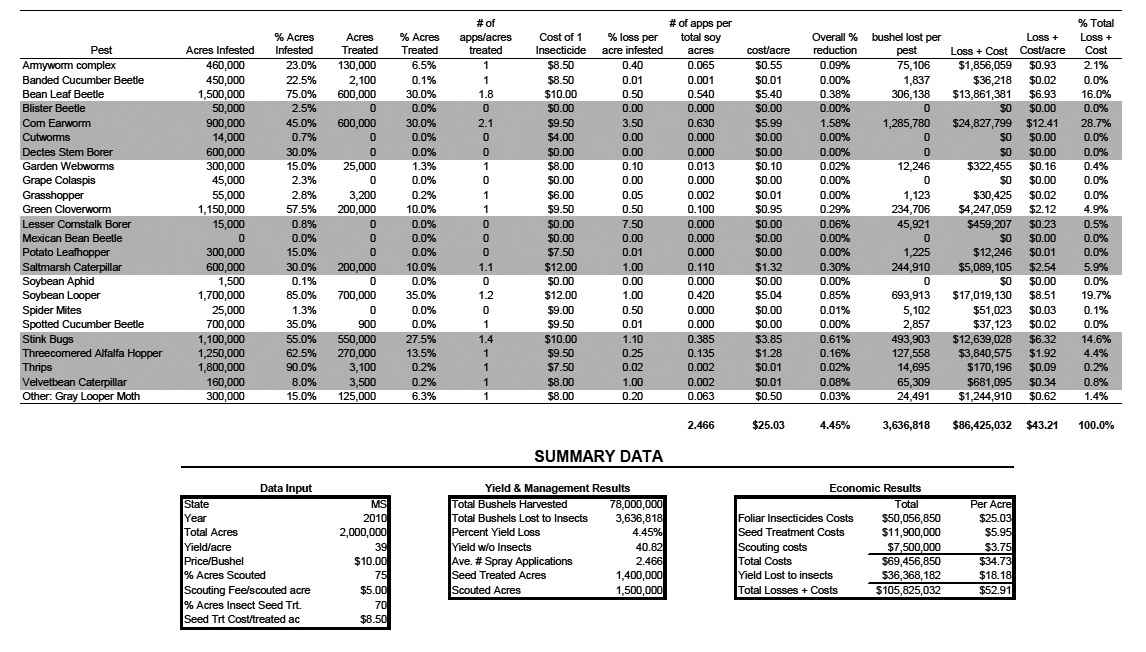
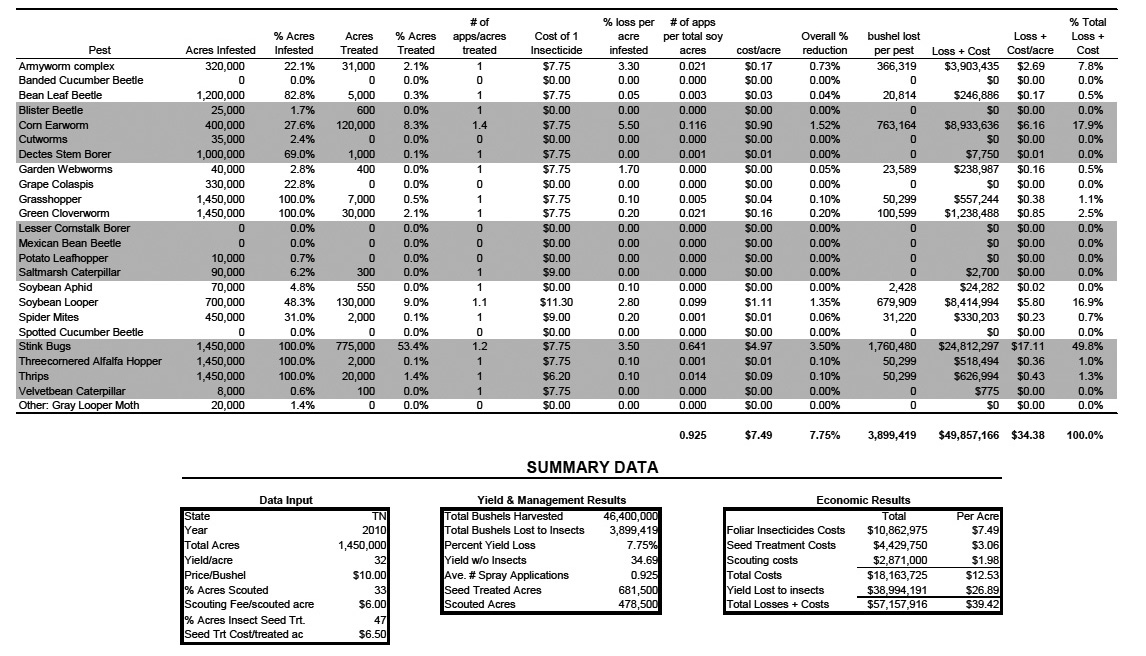
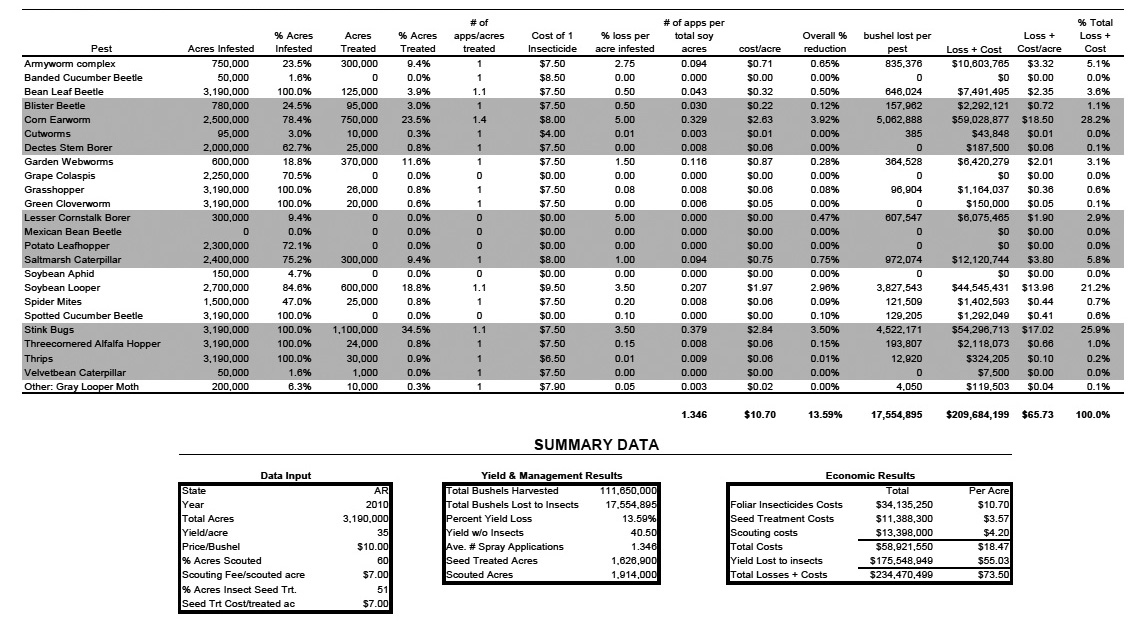
After several years of substantial increases in soybean acreage and use of seed treatments and crop consultants, there were few changes from 2009 to 2010 in Mississippi, Tennessee, or Arkansas (Table 1). Mississippi growers more intensively managed their crop than did growers in Arkansas and Tennessee, as Mississippi had a higher level of seed treatment adoption, a higher percentage of acres scouted, and applied more foliar insecticides. These higher levels of management in Mississippi resulted in lower estimated yield losses attributed to insects (4.5%) compared to Arkansas (13.8%) and Tennessee. (7.9%). Percent yield loss from insects continued to decline in 2010 in Mississippi. However, there were sharp increases in both Tennessee and Arkansas, largely attributed to damage from corn earworm. In spite of reduced insect losses in MS, total loss plus cost due to insects was higher than any previous year of the survey in all states, at least partially a result of higher prices for soybeans during 2010.
Table 1. Average soybean management and performance, 2004–2010. Values reported often differ slightly from earlier published losses due to changes in NASS yield and price estimates.
Year |
Acres (million)1 |
Yield (bu/ac)2 |
Price ($/bu) |
% acres scouted |
% acres with insect seed trt. |
No. foliar insecticide applications |
% yield loss to insects |
$ loss + cost/ac |
||
Mississippi |
|
|
|
|
|
|
||||
2004 |
1.67 |
37.5 |
6.20 |
10 |
0 |
0.89 |
8.09 |
25.46 |
||
2005 |
1.61 |
36.5 |
5.92 |
11 |
0 |
0.71 |
5.89 |
17.61 |
||
2006 |
1.67 |
26.0 |
6.23 |
15 |
0.01 |
1.04 |
6.12 |
19.12 |
||
2007 |
1.46 |
40.5 |
8.36 |
25 |
2 |
2.10 |
6.83 |
42.73 |
||
2008 |
2.00 |
40.0 |
9.29 |
55 |
50 |
2.41 |
5.11 |
50.99 |
||
2009 |
2.16 |
38.0 |
9.15 |
75 |
65 |
2.11 |
4.52 |
46.68 |
||
2010 |
2.00 |
39.0 |
10.003 |
75 |
70 |
2.47 |
4.45 |
52.91 |
||
Tennessee |
|
|
|
|
|
|
||||
2008 |
1.49 |
34.0 |
9.45 |
20 |
40 |
1.00 |
4.33 |
26.82 |
||
2009 |
1.57 |
45.0 |
9.65 |
30 |
50 |
0.32 |
2.19 |
18.50 |
||
2010 |
1.45 |
32.0 |
10.003 |
33 |
47 |
0.93 |
7.75 |
39.42 |
||
Arkansas |
|
|
|
|
|
|
||||
2009 |
3.42 |
37.5 |
9.60 |
65 |
40 |
1.37 |
4.34 |
35.03 |
||
2010 |
3.19 |
35.0 |
10.003 |
60 |
51 |
1.35 |
13.51 |
73.12 |
||
11 acre = 0.405 ha
2 1 bu/ac = 67.2 kg/ha
3 Estimate
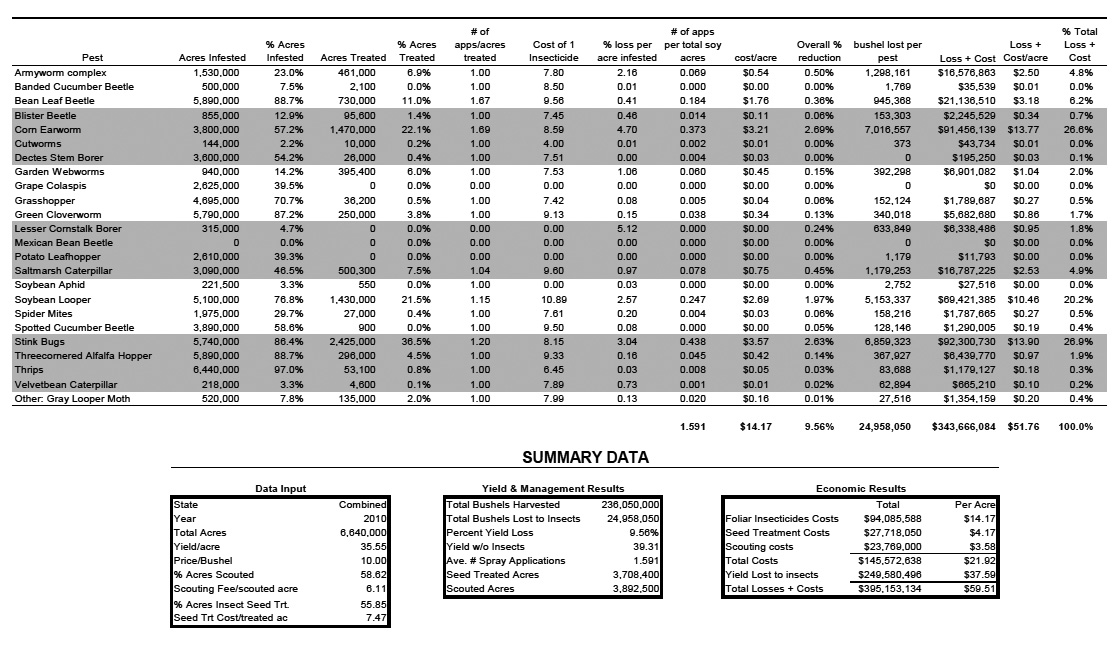
Stink bugs (Hemiptera: Pentatomidae) were always the primary pests in all states surveyed until this year. While still the primary foliar insecticide target in the region, several pests were more frequently sprayed than stink bugs in Mississippi. Stink bug pressure was lower in Mississippi during 2010 than in previous years while pressure in Arkansas and Tennessee was similar to previous years as reflected in the number of foliar applications directed at these pests (Table 2). The redbanded stink bug (Piezadorus guildinii), which was a substantial part of the stink bug complex in Mississippi and Arkansas during 2009, was largely absent from both states in 2010. Applications targeting corn earworm (Helicoverpa zea), soybean looper (Chrysodeixis includens), and bean leaf beetle (Cerotoma trifurcata) increased in all states compared to previous years. Saltmarsh caterpillar (Estigmene acrea) was one of the five most targeted insects overall during 2010 for the first time due to infestations in Mississippi and Arkansas. Applications targeting the threecornered alfalfa hopper (Spissistilus festinus) were lower in 2010 compared to past years in all states. The gray looper moth (Rachiplusia ou) was added to the list for 2010 due to some early season spraying targeting this insect in Mississippi and Arkansas. This is the first year since this survey began that the gray looper moth was the target of any insecticide applications in soybeans.
Table 2. Foliar insecticide use (No. applications per soybean acre) on major soybean pests during in Mississippi, Tennessee and Arkansas.
Pest |
MS _ |
TN _ |
AR _ |
Overall _ |
||||
|
2004–2009 |
2010 |
2008–2009 |
2010 |
2009 |
2010 |
2009 |
2010 |
Stink bug |
0.729 |
0.385 |
0.422 |
0.641 |
0.322 |
0.379 |
0.478 |
0.438 |
Corn earworm |
0.088 |
0.630 |
0.008 |
0.116 |
0.274 |
0.329 |
0.228 |
0.373 |
Soybean looper |
0.184 |
0.420 |
0.007 |
0.099 |
0.088 |
0.207 |
0.133 |
0.247 |
Bean leaf beetle |
0.262 |
0.540 |
0.006 |
0.003 |
0.050 |
0.043 |
0.075 |
0.184 |
Saltmarsh caterpillar |
0.005 |
0.110 |
0.000 |
0.000 |
0.000 |
0.094 |
0.000 |
0.078 |
Armyworms |
0.008 |
0.065 |
0.006 |
0.021 |
0.199 |
0.094 |
0.110 |
0.069 |
Threecornered alfalfa hopper |
0.231 |
0.135 |
0.088 |
0.001 |
0.146 |
0.008 |
0.166 |
0.045 |
All insects |
1.547 |
2.466 |
0.662 |
0.925 |
1.371 |
1.346 |
1.364 |
1.591 |
The ranks in 2010 overall losses plus costs (Table 3) mirror the number of insecticide applications (Table 2), with stink bugs causing the most losses closely followed by corn earworm and soybean looper. Total insect costs in losses and control measures were nearly double the costs of 2009. Insecticide costs increased only $3.53/ac, with the balance of the change due to higher estimated insect losses and higher value of the soybeans lost to insects.
Table 3. Estimated losses plus management costs ($/ac) due to insect pests in Mississippi, Tennessee, and Arkansas. Management costs do not include seed treatments and scouting fees.
Pest |
MS _ |
TN _ |
AR _ |
Overall _ |
||||
|
2004–2009 |
2010 |
2008–2009 |
2010 |
2009 |
2010 |
2009 |
2010 |
Stink bug |
14.65 |
6.32 |
10.35 |
17.11 |
8.51 |
17.02 |
9.69 |
13.90 |
Corn earworm |
1.93 |
12.41 |
1.51 |
6.16 |
7.09 |
18.50 |
6.26 |
13.77 |
Soybean looper |
4.56 |
8.51 |
0.19 |
5.80 |
1.08 |
13.96 |
2.40 |
10.46 |
Bean leaf beetle |
3.76 |
6.93 |
0.28 |
0.17 |
1.24 |
2.35 |
1.43 |
3.18 |
Saltmarsh caterpillar |
0.07 |
2.54 |
0.00 |
0.00 |
0.00 |
3.80 |
0.02 |
2.53 |
Armyworms |
0.19 |
0.93 |
0.29 |
2.69 |
2.91 |
3.32 |
1.71 |
2.50 |
Threecornered alfalfa hopper |
4.03 |
1.92 |
2.28 |
0.36 |
2.19 |
0.66 |
2.40 |
0.97 |
All insects |
30.66 |
43.21 |
17.76 |
34.38 |
27.00 |
65.73 |
26.85 |
51.76 |
References
Musser, F. R., and A. Catchot. 2008. Mississippi soybean insect losses. Midsouth Entomol. 1: 29-36.
Musser, F. R., S. D. Stewart, and A. L. Catchot, Jr. 2009. 2008 soybean insect losses for Mississippi and Tennessee. Midsouth Entomol. 2: 42-46.
Musser, F. R., G. M. Lorenz, S. D. Stewart, and A. L. Catchot, Jr. 2010. 2009 soybean insect losses for Mississippi, Tennessee, and Arkansas. Midsouth Entomol. 3: 48-54.
USDA NASS. NASS Data and Statistics, http://www.nass.usda.gov/Data_and_Statistics/Quick_Stats/index.asp.
Williams, M. R. 2006. Cotton insect losses, http://www.msstate.edu/Entomology/Cotton.html.
Appendix 1. Overall soybean insect losses from Mississippi, Tennessee, and Arkansas, 2010.

Appendix 2. Mississippi soybean insect losses, 2010.
Appendix 3. Tennessee soybean insect losses, 2010.
Appendix 4. Arkansas soybean insect losses, 2010.


